

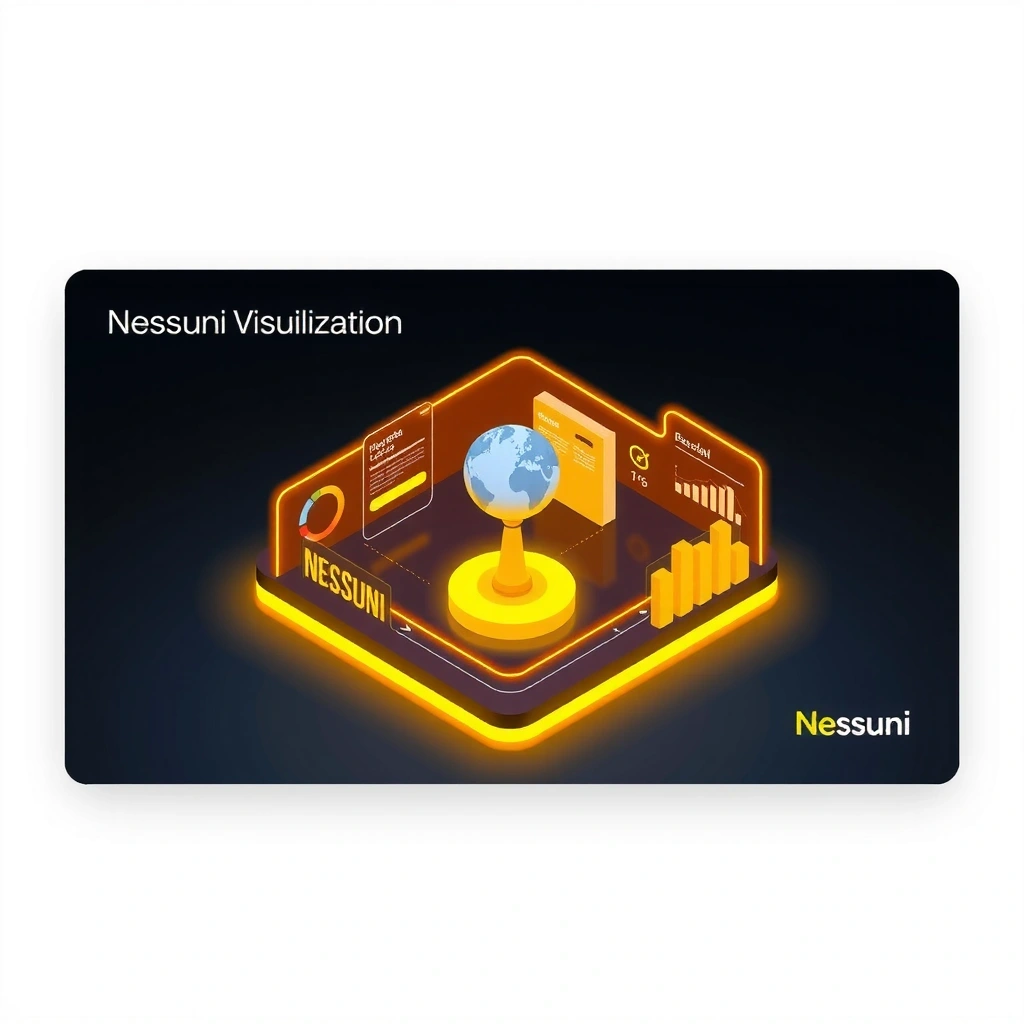
Unlock the Nessuni Engine
Discover the premium visualization toolkit designed for complex system analysis. Toggle between dynamic market logic and game economy simulations with precision control.
Core Architecture
Abstract nodes representing the unified framework
Visual Scripting
Node-based interface for mapping complex algorithmic dependencies with real-time flow analysis.
Asset Management
Structured container system for organizing data assets with version control integration.
Optimized SDK
Cross-platform deployment package with native performance profiling for mobile environments.
Dynamic Logic Visualizer
Toggle views to visualize the logic engines
Technical Specifications & Value
The Nessuni platform is optimized for high-performance environments. Ensure your system meets the minimum requirements for unlocking premium features.
Platform Support
- macOS 10.15+ (Catalina) - Metal API support
- Windows 10/11 (64-bit) - DirectX 12 compatible
- Android 12+ (API Level 31) - Vulkan 1.2
- Linux (Ubuntu 20.04+) - Latest drivers required
| Feature | Free | Premium |
|---|---|---|
| Visualization Engine | Basic | Unlocked |
| Data Export | Limited CSV | Unlocked |
| Concurrent Sessions | 1 | Unlimited |
| Priority Support | No | Unlocked |
Nessuni Field Guide: Understanding Logic Architecture
Core Concept
When toggling the visualizer, you are essentially swapping the rendering engine's interpretation layer. The "Game Economy" view smooths data points to visualize retention curves, while "Trading Logic" applies high-frequency bar structures to show variance.
Decision Criteria
- • Volatility: If your data set has rapid fluctuations, use Trading Logic view for better clarity.
- • Retention Focus: For long-term trend analysis in user growth, select Game Economy.
- • Node Density: High-density data requires the Trading Logic parser to prevent visual clutter.
Myth vs. Fact
Myth:
"The visualizer is just cosmetic and doesn't affect data processing."
Fact:
The view mode alters the parsing algorithm. Switching modes changes how raw data is interpolated, affecting the granular details displayed in the SVG output.
Mini-Glossary
Implementation Workflow
Four steps to integrate the Nessuni engine
Define Goal
Identify whether you need economy tracking or market analysis.
Validate
Check your dataset against platform requirements.
Apply Method
Use the visualizer to configure your node structure.
Review
Export data and verify logic flow consistency.
The Precision Edge
When you combine Game Economy stochastic modeling with Trading Logic volatility analysis, you unlock a new class of predictive tools. Nessuni bridges the gap between entertainment metrics and financial modeling, offering a unified dashboard for complex system telemetry.
Need more details? Visit the Anniversary Timeline for version history or check our Privacy Policy.